How data-geo works: WorldPop
WorldPop publishes its population grids as one GeoTIFF per country and year, from servers that ignore range requests: one city means downloading the country (160 MB for Ethiopia, per year). data-geo re-publishes WorldPop R2025A (100 m, 2015–2030, total population and age and sex) as cloud-native files anyone can read by range, with an API that counts people in any place or shape. Built in the open; numbers on this page are measurements, dated.
Data © WorldPop, R2025A v1 constrained, CC BY 4.0. Cite WorldPop for every figure: see licence and citation. data-geo is run by Baobab Tech and is not affiliated with or endorsed by WorldPop.
WorldPop's API
Both serve WorldPop R2025A at 100 m for 2015–2030 under CC BY 4.0, and both count a cell when its centre is inside the area, so their polygon totals agree to under one person. WorldPop launched API v3 (3.0.0) in early November 2026, with a guide for agents and an MCP server at /v3/mcp. Measured 5 November 2026; server times are what each API reports for itself (processing_time_ms, milliseconds).
| WorldPop API v3 | data-geo | |
|---|---|---|
| Access | Free key, by registration and approval; capped without one | No key |
| Quota | 1,000 requests a day anonymous, 10,000 with a key; 60 a minute, 3 at once | 2,000 API calls an hour per IP, polygons limited more tightly; no daily quota |
| Largest polygon | 100,000 km² anonymous; 500,000 with a key (up to 1,000,000) | Any size up to a whole country (Ethiopia, 1.1 million km², in 3–5 s) |
| City polygon, server time | 42 ms | 59 ms median from the cache, 0.45 s on a first read |
| Same box, 4 years | 58 ms | 0.1–0.3 s from the cache, 1 s on a first read |
| Catchment, 3 radii | 41 ms | about 0.2 s |
| 4° × 4° box (197,000 km²) | 413 without a key | 24.8 million people, 0.2 s |
| Age and sex years | All 16 | 2015, 2020, 2025, 2030 |
| Administrative units | WorldPop's own (Kenya: 8 former provinces) | geoBoundaries ADM0–ADM2, with each boundary's source and licence (Kenya: 47 counties and their sub-counties) |
| Files | GeoTIFFs and zips on data.worldpop.org, no range reads; /raster cuts a GeoTIFF of an area |
COGs, VRTs, Zarr cube, sum pyramids, Parquet admin totals and STAC, all read by range |
| How an answer was built | Processing time | method: stored sums used, tiles read, files, cache hits |
WorldPop is faster on small queries (about 40–60 ms against 60–450 ms here); data-geo answers large areas without a key.
- Only WorldPop v3: age and sex in every year; place profiles with Vega-Lite charts and PNGs, comparisons of 2–8 places, country maps; exposure to points, lines or polygons weighted by distance; batches of up to 1,000 features, ranked; catchments around up to 100 points in one call; search by place name; an MCP server.
- Only data-geo: every file readable by range from GDAL, xarray, DuckDB or QGIS, including a cube with all 16 years in each chunk; polygons up to a whole country with no key; geoBoundaries ADM1 and ADM2 units;
methodin every polygon answer. - Both: population for any polygon, point or unit; several years in one request with change and peak; indicators under the same names; catchments around one point.
On files: WorldPop's API links each country's GeoTIFFs on data.worldpop.org (/countries/{iso3}/files), which answer a range with the whole file, and its /raster cuts a GeoTIFF of an area on request. In October 2026 WorldPop said it plans a GeoZarr release at 1 km and to host its next release on AWS Open Data; on 5 November 2026 the registry listed no WorldPop dataset. When WorldPop's own files can be read by range, this page will say so and point to them.
The same requests to both, 5 November 2026:
| Query | WorldPop v3 | data-geo |
|---|---|---|
| Cell at 36.8219, −1.2921, 2025 | 67.84 | 67.84 |
| Box over central Addis (38.70–38.80, 8.98–9.06), 2025 | 1,606,480.21 | 1,606,479.47 |
| The same box, 2015, 2020, 2025, 2030 in one request | 1,266,918.96; 1,435,807.10; 1,606,480.21; 1,780,608.16 | 1,266,919.47; 1,435,807.72; 1,606,479.47; 1,780,608.09 |
| Change 2015–2030 on that box | +513,689.19, +40.55%, 2.3% a year, peak 2030 | +513,688.61, +40.55%, 2.30% a year, peak 2030 |
| Indicators, that box, 2025 | median age 25.3, sex ratio 93.2, dependency 33.0 (young 28.5, old 4.5), ageing index 15.8, child-woman ratio 22.6, under 5 0.0773, 65+ 0.0339 | 25.3, 93.18, 33.04 (28.54, 4.51), 15.8, 22.62, 0.0773, 0.0339 |
| Within 1, 5, 10 km of 36.8219, −1.2921, 2025 | 27,220.88; 937,123.38; 3,205,739.24 | 27,013.73; 935,401.62; 3,204,498.01 |
| That box, age and sex, 2023 | 1,537,578.24 in 40 groups | 404: age and sex for 2015, 2020, 2025, 2030 only |
| 4° × 4° box around Nairobi (197,000 km²), 2025 | 413 without a key (limit 100,000 km²) | 24,813,185 |
| Kenya's units | 8 (the former provinces) | geoBoundaries: 47 counties (ADM1) and ADM2 below |
Polygon totals agree to under one person in every year: both count a cell when its centre is inside. Catchments differ by 0.8% at 1 km, 0.2% at 5 km and 0.04% at 10 km. WorldPop does not say how it draws a circle; here it is a 256-sided polygon counted by cell centres, and at 1 km the circle's edge crosses about 60 of the roughly 300 cells inside it, so any difference in how the edge is drawn weighs most there.
What you can use
The API at https://data-geo.baobabtech.app/v1/worldpop/:
| Call | Answers |
|---|---|
POST polygon?year= with GeoJSON |
People inside any polygon, exactly |
GET catchment?lon=&lat=&radii=1,5,10&year= |
People within each distance of a point, and between them |
GET point?lon=&lat=&year= |
People in the 100 m cell under a point |
GET totals?iso3=&level=&year= |
Every administrative unit (geoBoundaries ADM0–2) of a country |
GET total?iso3=&unit=&year= |
One unit, with its boundary's source and licence |
Each takes:
| Parameter | Gives |
|---|---|
years=2015-2030 or years=2015,2020,2025 in place of year |
Every year asked, the change from first to last (absolute, percent, compound annual growth) and the peak year |
groups=all, summary or a list (under5, women_15_49, f_20 …) |
People by sex and age group |
indicators=true |
Median age, sex ratio, dependency ratios, ageing index, child-woman ratio and age shares |
Groups and indicators cover 2015, 2020, 2025 and 2030; a request for any other year answers 404 with missing_years.
The files, under https://data-geo.baobabtech.app/worldpop/r2025a/, read by range from GDAL, rasterio, xarray, DuckDB or QGIS. Paths never change; a new release gets a new path. Country codes in file names are lower case (eth.tif).
| Path | What |
|---|---|
100m/{year}/{iso3}.tif |
Population COG per country and year: float32, EPSG:4326, nodata −99999, 512 × 512 tiles, DEFLATE + floating-point predictor |
100m/{year}/global.vrt |
Every country of a year as one raster |
100m.zarr/ |
Zarr v3 population(time, y, x), all 16 years in each 512 × 512 chunk: a time series in one read |
pyramid/{year}/1km.tif, 10km.tif |
Exact sums of the 100 m grid (sum, count of valued cells; float64) |
admin_totals.parquet |
One row per unit, one column per year, one row group per country |
agesex/100m/{year}/{iso3}.tif |
43 bands per cell: population, f_00 … f_90, m_00 … m_90, f_under18, m_under18; 32 × 32 tiles, no predictor, empty tiles unwritten |
agesex/100m/{year}/global.vrt, agesex/pyramid/{year}/, agesex/admin_totals/{year}.parquet |
The same three for sex and age |
manifest.json |
Every file's size and SHA-256; per COG, its WorldPop source URL and SHA-256, sum and cell count |
stac/catalog.json |
STAC 1.0: one item per country and year (items/{year}/{iso3}.json), one per year for the VRT and pyramid (items/{year}/global.json) |
At the root, /catalog.json (also GET /v1/catalog) says per year whether it is complete, which countries are in and which are confirmed absent; /worldpop/latest.json names the current release. The manifest, STAC and catalogue are generated from the bucket and rewritten as files land; the files they list never change.
Agents: /llms.txt. Tools: /openapi.json. This page as markdown.
Live test
Every endpoint, tested live from Helsinki on 24 October 2026 (the age and sex rows on 1 November), worldwide data.
Working
| Test | Result |
|---|---|
| Point, Lagos 2026 | 237 people in the cell, from Nigeria's file · 0.65 s |
| Point, Mumbai 2026 | 152 people · 0.9 s |
| Polygon, 5 km circle around Lagos 2026 | 1,169,347 people · 0.7–1.0 s |
| Age-sex at a point, Nairobi 2025 | 68 people: 32 female, 36 male, 6 under 5, 19 under 18 · 0.4–0.6 s |
| Admin totals with age and sex, Kenya's 47 counties 2025 | 0.6 s |
| Range read of Nigeria's 2026 file | 16 KB in 0.4 s |
/, /llms.txt, /openapi.json, how-it-works page and markdown, diagrams |
all serve |
Correctly refused
| Request | Answer |
|---|---|
| Point in the mid-Atlantic | 404, no country file covers it |
| Age-sex polygon, worldwide 2026 | 404, worldwide age-sex not published yet |
| Polygon for 2024 | 404, not published yet (downloading now) |
| Admin totals, default release | 404, not built worldwide yet |
| GeoJSON Point sent as a polygon | 400, with the reason |
Also live, 2026: central Jakarta, 8,615,605 people in 0.9 s; a box across the Benin–Nigeria border, 30,500,961 in 1.2 s; all of Ethiopia by its boundary, 137,022,972 in 8.2 s. The 2026 sum grids total 8,264,687,130 people, equal to the 242 country files; 13 territories have no WorldPop 100 m file.
How the answers are computed
One counting rule. A 100 m cell belongs to an area when its centre is inside it (even-odd, so holes and multipolygons work). Polygons, admin totals and every age and sex group use it, so a polygon of an administrative boundary returns that unit's total and a breakdown adds up to its total.
One grid, never resampled. WorldPop stores the cell size as 0.00083333333, not exactly 1/1200°. On the stored value every country file starts on a whole cell from (−180, 90); on 1/1200 every one looks slightly off. Every product here is indexed on the stored value, so countries are placed by integer offsets and nothing is resampled (resampling a count grid changes its totals).
Polygons, coarse to fine. Counting a country cell by cell is ~250 million tests. People add up, so a 10 km cell stores exactly the total of the 10,000 cells under it, and a polygon is answered from the sum pyramid:
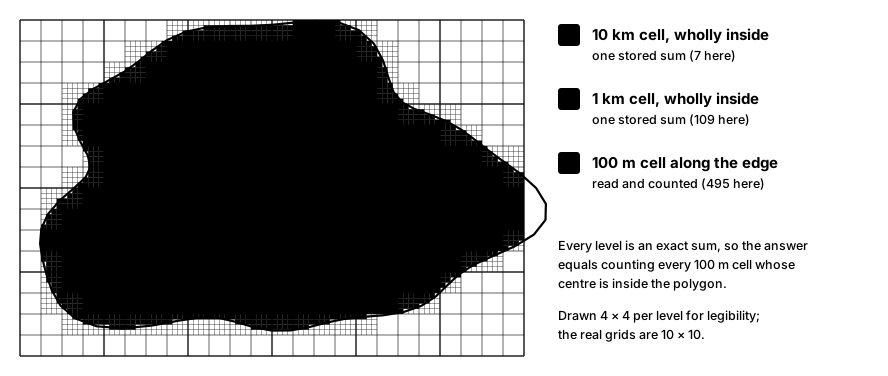
- Trace the polygon once: for each 100 m row, the runs of columns whose centres are inside.
- 10 km cells wholly inside add their stored sum.
- Inside the 10 km cells the edge cuts, 1 km cells wholly inside add theirs.
- Only inside the 1 km cells the edge still cuts are 100 m cells read and counted.
The answer equals a cell-by-cell count: checked against an independent Python count (rasterio, same rule) on Nairobi, Addis Ababa, a box across the Ethiopia–Kenya border, a square with a hole and all of Ethiopia, identical in population and cells; and for all 42 age and sex groups, within 7e-15 (float64 rounding). The response's method shows how many stored sums and 100 m tiles were used.
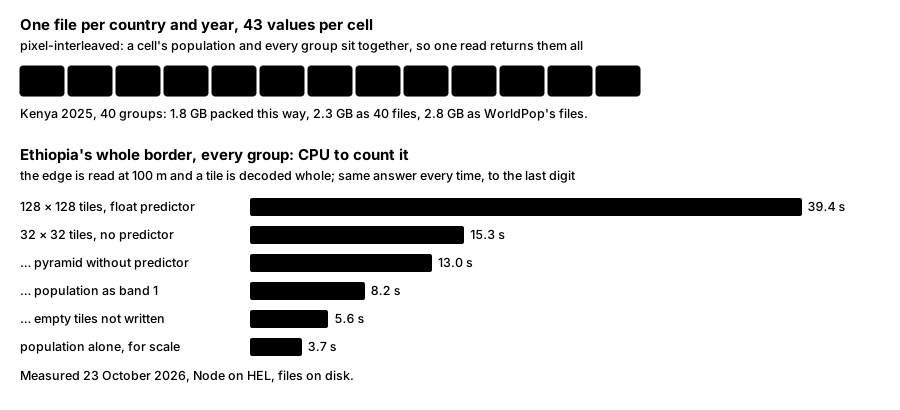
Sex and age. One 43-band file per country and year puts a cell's whole breakdown together, so one read returns every group. WorldPop's both-sexes files are not kept (each equals female + male within 1.5e-5 of a person) nor its 1 km mosaics (the sums here are exact); under 18 is kept, since five-year groups split 15–19. Against the total, the 40 groups agree within 3.1e-5 of a person per cell and about one person per country (Ethiopia and Kenya, all years).
Several years. Which 10 km and 1 km cells lie wholly inside a polygon, and which 1 km cells its edge cuts, depends only on the shape, since every year's pyramid has the same grid. With years that plan is made once; then each year's stored sums and edge cells are read, four years at a time (two for a country-sized edge), the edge from that year's own files. Each year's answer equals that year asked alone, to the person: checked on the five test polygons for all 16 years (5 November 2026). Admin totals hold every year in one row, so years there costs nothing more.
Indicators are arithmetic on the 42 age and sex sums of the same cells, so they follow the counting rule. The names and definitions are those of WorldPop's API v3, so the two can be compared field by field: median age by linear interpolation inside the five-year group holding the half-way person (90 and over taken as 90–100); ratios per 100; shares of everyone with age and sex data. On the central Addis box, 2025, every indicator agrees with WorldPop's to its rounding (below).
Catchments. Each radius is a geodesic circle, built as a polygon of 256 points at that distance on a sphere of radius 6,371,008.8 m (WGS84's mean), then counted like any polygon. The 256-sided polygon lies inside the circle and covers 99.99% of its area. Five kilometres around central Nairobi, 2025: 935,402 people; a 64-sided circle gives 931,744.
Where the code runs. A Cloudflare Worker: JavaScript in a V8 isolate, no GDAL. It reads byte ranges from storage, inflates tiles with the runtime's native zlib and adds up. A file's tile index is read in pages, only where a polygon needs it: the age and sex files of countries that cross the antimeridian span the whole grid in 32 × 32 tiles (the USA's has 26.5 million), and loading such an index whole broke the Worker's 128 MB memory limit until 4 November 2026. Workers bill CPU time, not waiting; ours is pinned beside the bucket so its few hundred reads per polygon are local. Reprojection, clipped GeoTIFFs and bulk ranking would need a separate compute service; none is needed for these endpoints.
Speed
Measured 23 October 2026 from Helsinki on Ethiopia and Kenya data; "warm" is a second request on an instance holding the files' headers.
| Polygon | 10 km sums | 1 km sums | 100 m tiles | CPU | Answer |
|---|---|---|---|---|---|
| Box across the Ethiopia–Kenya border | 1,944 | 0 | 0 | 22 ms | 0.6 s |
| Square with a hole, Addis Ababa | 33 | 1,560 | 0 | 35 ms | 1.2 s |
| Addis Ababa | 1 | 473 | 2 | 89 ms | 1.3 s |
| Nairobi | 2 | 511 | 4 | 112 ms | 2.0 s, warm 1.3 s |
| All of Ethiopia | 12,969 | 33,364 | 155 | 2.3 s | 8.0 s, warm 4.4 s |
With every age and sex group (groups=all), through wrangler dev --remote, so every read crossed the Atlantic; CPU measured locally, an upper bound:
| Polygon | 100 m tiles (32 × 32) | Reads | Bytes read | CPU | Answer |
|---|---|---|---|---|---|
| Addis Ababa | 47 | 24 | 10 MB | 0.6 s | 1.3 s, repeat 0.3 s |
| Nairobi | 66 | 23 | 11 MB | 0.4 s | 3.1 s, repeat 0.3 s |
| All of Ethiopia | 3,079 | 558 | 51 MB | 5.6 s | 13.5–16.3 s |
Live on 4 November 2026, after the memory fix, all of Ethiopia with every group answered in 25 s (9.4 s of CPU); city boxes in 0.5–1.4 s.
For an administrative unit, totals with groups answers in 0.2 s warm (Kenya's 47 counties, 1.3 s cold).
The shared cache. Requests rarely land on an instance that already holds a file's header: of ten calls in a row, most started fresh. Every instance in a Cloudflare data centre shares that data centre's cache, so the headers, tile indexes, VRTs and Parquet footers, and the 100 m tiles of city-sized shapes, are kept there after the first read; published files never change, so nothing kept can go stale. A country-sized edge skips it for tiles: filling the cache with Ethiopia's border over nine years cost 47 s of CPU against 31 s. Each answer's x-cache-reads header, and method.cache in polygon and catchment answers, count what came from the cache. Median of ten calls, server time, 5 November 2026, 2025 data:
| Polygon | No shared cache | Headers and indexes cached | Tiles cached too |
|---|---|---|---|
| Box over central Addis Ababa | 446 ms | 265 ms | 59 ms |
| Nairobi county | 451 ms | 542 ms | 132 ms |
| All of Ethiopia | 3.2 s | 3.5 s | 3.2–4.6 s (tiles not cached; decoding is the cost) |
Several years, live on 5 November 2026: the central Addis box for 2015, 2020, 2025 and 2030 in one request, 0.97 s on first read and 0.1–0.3 s after (WorldPop v3: 58 ms); Nairobi county for those four years with every group and indicators, 4.5–5.2 s; within 1, 5, 10, 25 and 50 km of central Lagos for all 16 years, 11–17 s; all of Ethiopia for nine years, 37–74 s.
Reading files directly from Helsinki:
| Read | Time |
|---|---|
| One year, a city window, from a COG (cold) | 0.3–0.9 s, in 4–5 requests |
| Addis Ababa box, all 16 years, from the Zarr cube | 2.4 s |
| The same, from 16 COG reads | 11.0 s |
| Nairobi box, all 16 years, cube vs 16 COGs | 2.0 s vs 4.7 s |
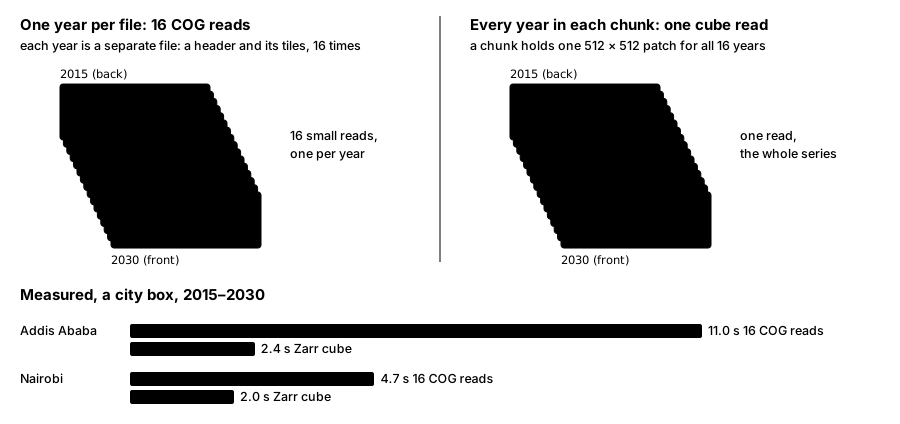
One year: a COG. A time series: the cube.
How it is built
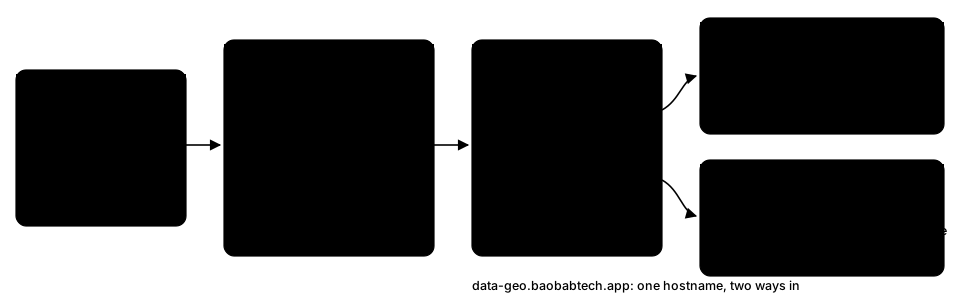
One server in Helsinki (64 cores, 314 GB RAM) is the only writer. Per year it downloads every country, converts, checks, uploads, then builds the global VRT and the sum pyramid, each uploaded only if its checks pass:
- Every population COG against WorldPop's file: same total, valued cells, CRS, transform, shape, nodata and type, and the same values over three fixed windows. Lossless; 12–18% smaller than the original.
- Every age and sex band against its file, over every cell. The 43 bands compress better together: Kenya 2025's 40 groups take 1.80 GB in one file, 2.29 GB as 40 COGs, 2.76 GB as WorldPop's files.
- The grid and the borders: every country on whole cells; countries whose boxes overlap tested for any cell both claim (none may).
- Derived files against their sources: the cube cell for cell, every year; each pyramid's total equals its COGs'; admin totals account for every person, reporting population outside every unit separately.
- Absences are confirmed, not assumed: a territory WorldPop answers 404 for is recorded as having no file; a dropped connection is retried.
- Every file is read back by range at its public address before the VRT or pyramid that points to it goes up: the first 16 KB, under a query string the edge has never seen so the read is cold, must come back as 206 with the file's size, or nothing is published.
What we learned
- A 200 is not a range response. Both WorldPop servers advertise ranges and ignore them. Our own edge did it too: Cloudflare's cache holds files up to 512 MB on this plan, and the first ranged read of a larger file at a data centre came back as 200 with the whole file, which GDAL refuses (found 24 October 2026 on the largest countries, the age and sex files and the 1 km pyramid). The fix, set the same day, is a cache rule that has the edge fetch 1 MiB ranges from storage instead: eight large files never read before then all answered 206 on the first read.
- The stored cell size is the grid,
0.00083333333; four islands even store it with noise in the 17th digit (~1e-11 of a cell across a file), so alignment is measured as drift, not equality. - Sum pyramids, not overviews. Overviews average, which is wrong for counts.
- Decoding was the cost, not arithmetic. 96% of the Worker's CPU on Ethiopia went to decoding tiles in JavaScript; native zlib and a one-pass predictor undo took it from about 6 s to 2.3 s.
- With many bands, the tile is the unit of waste. A polygon's edge needs a thin line of cells; a tile is decoded whole. Ethiopia's border with 43 bands cost 39 s of CPU at 128 × 128 tiles with the predictor, 5.6 s at 32 × 32 without it, with empty tiles unwritten and neighbouring tiles fetched in one read (3,202 reads became 558).
- Run the code next to the data. Pinning the Worker beside the bucket took a country-sized polygon from failing to 4–8 s, with the decoding fix.
- Country files are overlapping rectangles. Benin's covers Lagos; a point takes the file that holds a value there, not the first that covers it.
- WorldPop drops about one request in eight at ten seconds, and drops rather than 404s some absent folders; retries and asking the folder above sort both out. Downloads run at 2.2–2.4 MB/s per stream.
- Two GDAL settings made reads ten times slower:
GDAL_HTTP_MULTIPLEX=YESandGDAL_HTTP_MERGE_CONSECUTIVE_RANGES=YES(113 s against 11 s). Set onlyGDAL_DISABLE_READDIR_ON_OPEN=EMPTY_DIR.
Limits
- Coverage: population on the API for all 16 years worldwide; age and sex, and so indicators, for 2015, 2020, 2025 and 2030 worldwide, and every year for Ethiopia and Kenya under
release=r2025a/_test(31 October 2026;/v1/catalogsays which). - Boundaries: geoBoundaries does not cover everyone: for 2030, 69.5 million people fall in no ADM0 unit, 47.4 million in no ADM1 unit and 55.3 million in no ADM2 unit (China 29.6 million at ADM0, Russia 20.5 million or 14% at ADM2, Argentina 4.0 million or 8.6%). They are counted in the country's file, not in any unit;
worldpop/r2025a/admin_totals.unassigned.jsonlists them per country, level and year. 13 territories have no boundaries at all (among them Hong Kong, Macao, Puerto Rico and Western Sahara) and have nototals. - Nepal's groups: In about 69,000 cells of its south (83.9–87.2°E, 26.6–27.8°N) WorldPop's groups add up to about a tenth of
population, so its 40 groups sum to 554,616 people less (1.8%, 2030); the same in all four years. WorldPop's own files show it: on 1 November 2026 a fresh download of all four years equalled our bands cell for cell, and its other total files carry the same shortfall. - Rate: 2,000 API calls (
/v1) an hour per IP, counted per clock hour; every answer carriesX-RateLimit-Limit,X-RateLimit-RemainingandX-RateLimit-Reset, and past the limit a 429 withRetry-Afteruntil the hour ends. The polygon endpoint is also limited per minute, and all requests, file reads included, per few seconds: send polygons in small, paced batches; over those you get a 429 for a minute or so. The hourly count is approximate (calls at the same instant can count once). A one-year read is 4–5 requests; a large Zarr read can be hundreds. - Polygon size: up to 60,000 rows of 100 m cells (50° of latitude) and 4,000 tiles of 100 m edge; beyond either, a 413 naming the limit. Ethiopia's border is 155 tiles.
- Several years: a polygon or catchment reads its edge once per year, and a request has 60 s of CPU. Past 70,000 1 km edge cells times years (age and sex counted twice) the answer is a 413 before anything is read: all of Ethiopia (7,041 edge cells) answers for up to 9 years at once, or 4 with groups. For more, ask in parts, use
totals, or read the Zarr cube. Measured live on 5 November 2026: Ethiopia for 2015–2023 took 33 s of CPU and answered in 67 s; for 2015, 2020, 2025 and 2030 with groups and indicators, 18 s of CPU and 104 s. - Catchments: up to 10 radii of at most 100 km around one point; circles may not cross the antimeridian.
- Under 18: WorldPop has no under-18 files for Russia, Fiji and Greenland; an
under18figure touching them is null, never an undercount. - Products: WorldPop's constrained 100 m files only; not its 1 km products or undocumented variant folders (
*_ttp,*_v0,GBR_L2,NGA_L2,USA_States). No reprojection or clipped downloads. - Paths are lower case.
ETH.tifredirects (301) toeth.tif. A missing file answers a small JSON 404 that points to/catalog.json. - Location: the bucket is in eastern North America. The API runs beside it; a direct file read from Europe or Africa pays about 100 ms per range request.
Licence and citation
WorldPop's data is licensed under CC BY 4.0 by WorldPop's licence statement. Cite the product each figure comes from, as WorldPop asks:
- Population: Bondarenko M., Priyatikanto R., Tejedor-Garavito N., Zhang W., McKeen T., Cunningham A., Woods T., Hilton J., Cihan D., Nosatiuk B., Brinkhoff T., Tatem A., Sorichetta A. 2025 Constrained estimates of 2015-2030 total number of people per grid square at a resolution of 3 arc (approximately 100m at the equator) R2025A version v1. Global Demographic Data Project - Funded by The Bill and Melinda Gates Foundation (INV-045237). WorldPop - School of Geography and Environmental Science, University of Southampton. DOI:10.5258/SOTON/WP00839
- Age and sex: Bondarenko M., Priyatikanto R., Tejedor-Garavito N., Zhang W., McKeen T., Cunningham A., Woods T., Hilton J., Cihan D., Nosatiuk B., Brinkhoff T., Tatem A., Sorichetta A. 2025. Estimates of 2015-2030 total number of people per grid square broken down by gender and age groupings at a resolution of 3 arc (approximately 100m at the equator) R2025A version v1. Global Demographic Data Project - Funded by The Bill and Melinda Gates Foundation (INV-045237). WorldPop - School of Geography and Environmental Science, University of Southampton. DOI:10.5258/SOTON/WP00841
- Under 18: Bondarenko M., Priyatikanto R., Tejedor-Garavito N., Zhang W., McKeen T., Cunningham A., Woods T., Hilton J., Cihan D., Nosatiuk B., Brinkhoff T., Tatem A., Sorichetta A. Estimates of total number of people under the age of 18 years old and broken down by male and female for each year 2015-2030 at a resolution of 3 arc (approximately 100m at the equator) R2025A version v1. Global Demographic Data Project - Funded by The Bill and Melinda Gates Foundation (INV-045237). WorldPop - School of Geography and Environmental Science, University of Southampton. DOI:10.5258/SOTON/WP00847
Changes made by data-geo: country files re-encoded as cloud-optimised GeoTIFFs with every value kept, age and sex files combined into one file per country and year, and new products computed from them: global VRTs, the Zarr cube, sum pyramids, admin totals and API counts. The checks are under How it is built.
WorldPop's notices, as they publish them: "The dataset currently represents an alpha version (R2025A) product and may change over the coming year as improvements are made." and "This data is not intended, and should not be used, for purposes that discriminate against, exploit, surveil, or otherwise harm individuals or vulnerable populations; users are expected to apply it responsibly, assess the risks of their own analyses (particularly when combining it with other datasets) and are solely responsible for how they use it."
Boundaries come from geoBoundaries; each unit's answer carries its own source, year and licence.
This page is rendered from /worldpop/how-it-works.md.